Monitoring Application
From the Administration UI there are possibilities to monitor how the integration jobs are doing.
The first screen being shown after logging in to the application, is a dashboard page showing:
-
The most recent used services
-
Some statistics over the past days executed jobs
-
A table showing the recently failed (and unresolved) jobs.
See the example image below:

On this dashboard page, you can in case you have installed an extension from the Marketplace, also filter to only show jobs and services related to a particular extension/connector.
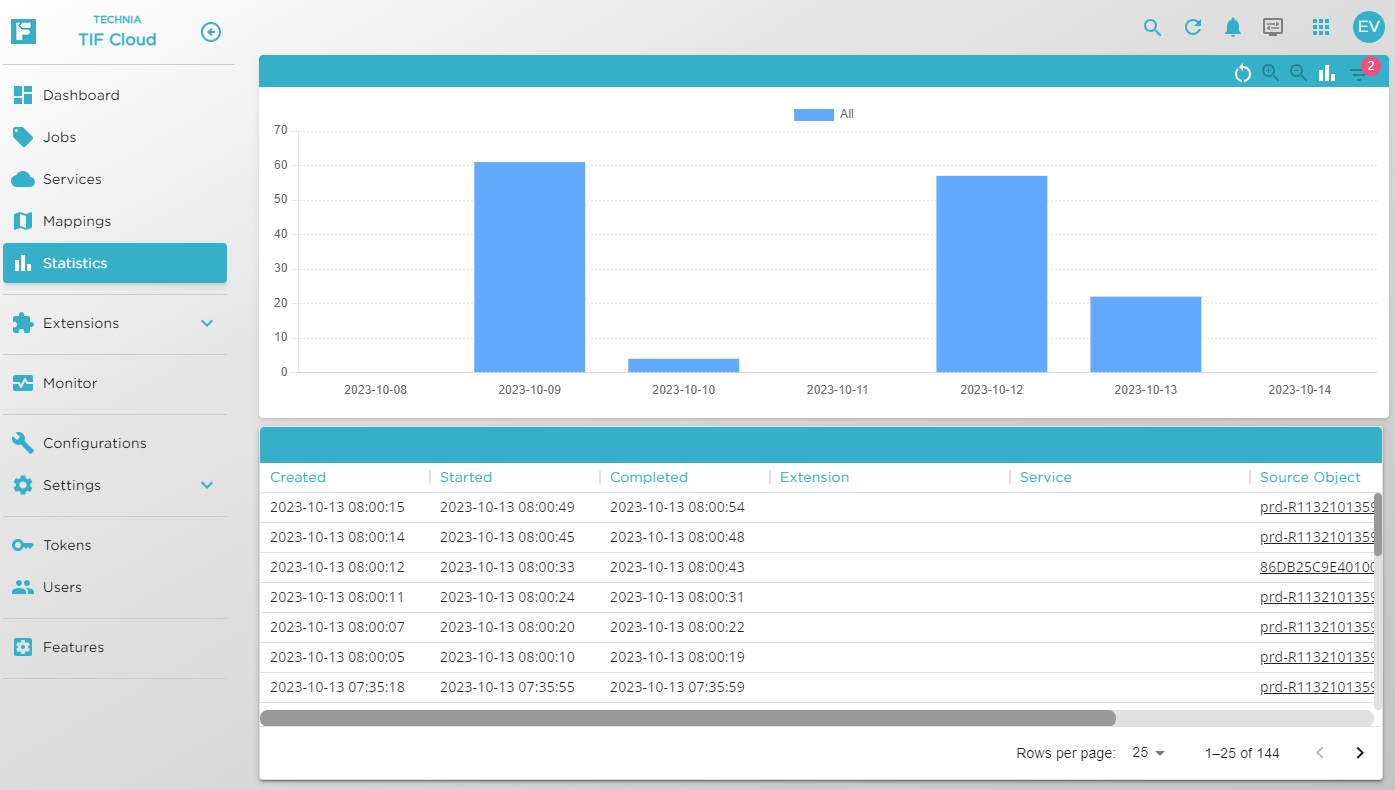
Statistics
The statistics page allows you to view/filter/drill-down jobs at certain time intervals.
See image below.
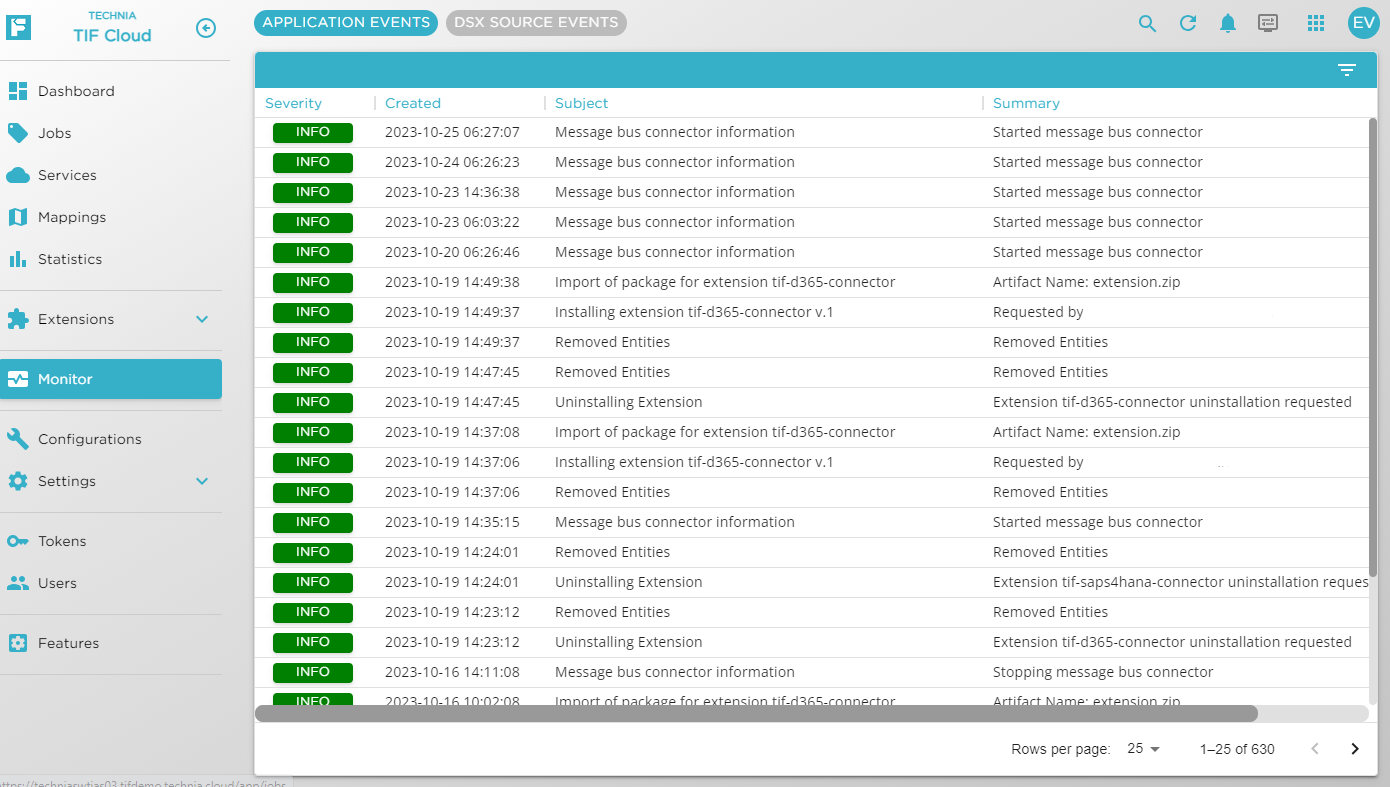
Application Events
Application events shows different events related to the application.
DSX Source Events
All events generated by the 3DEXPERIENCE™ application, which we have received will be traced. You can access those events from the Monitor → DSX Source Events page.
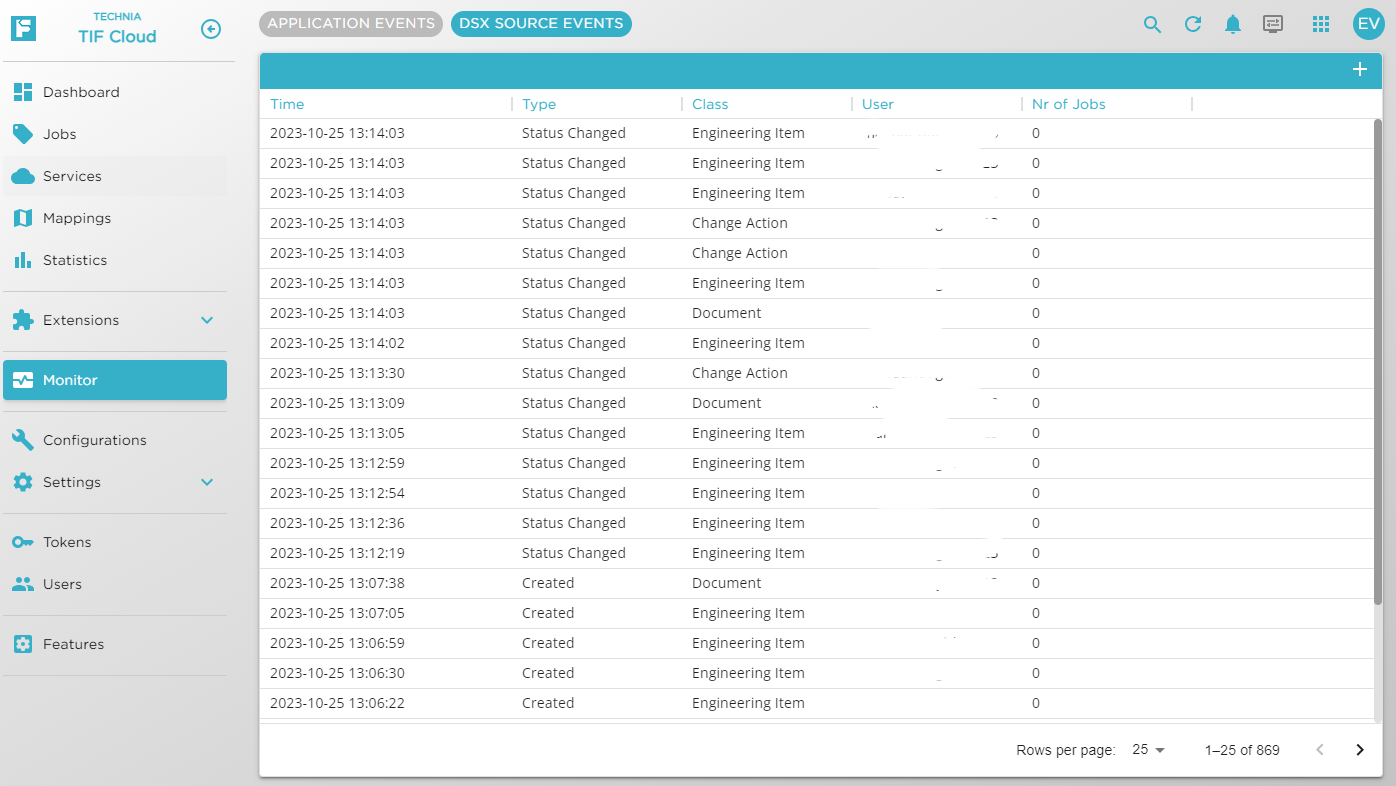
From there you can view the details of the event as well as how many jobs/which jobs that the particular event caused.